
.webp)

Step 1: Go to Claude Artifacts and click
+ New Artifact
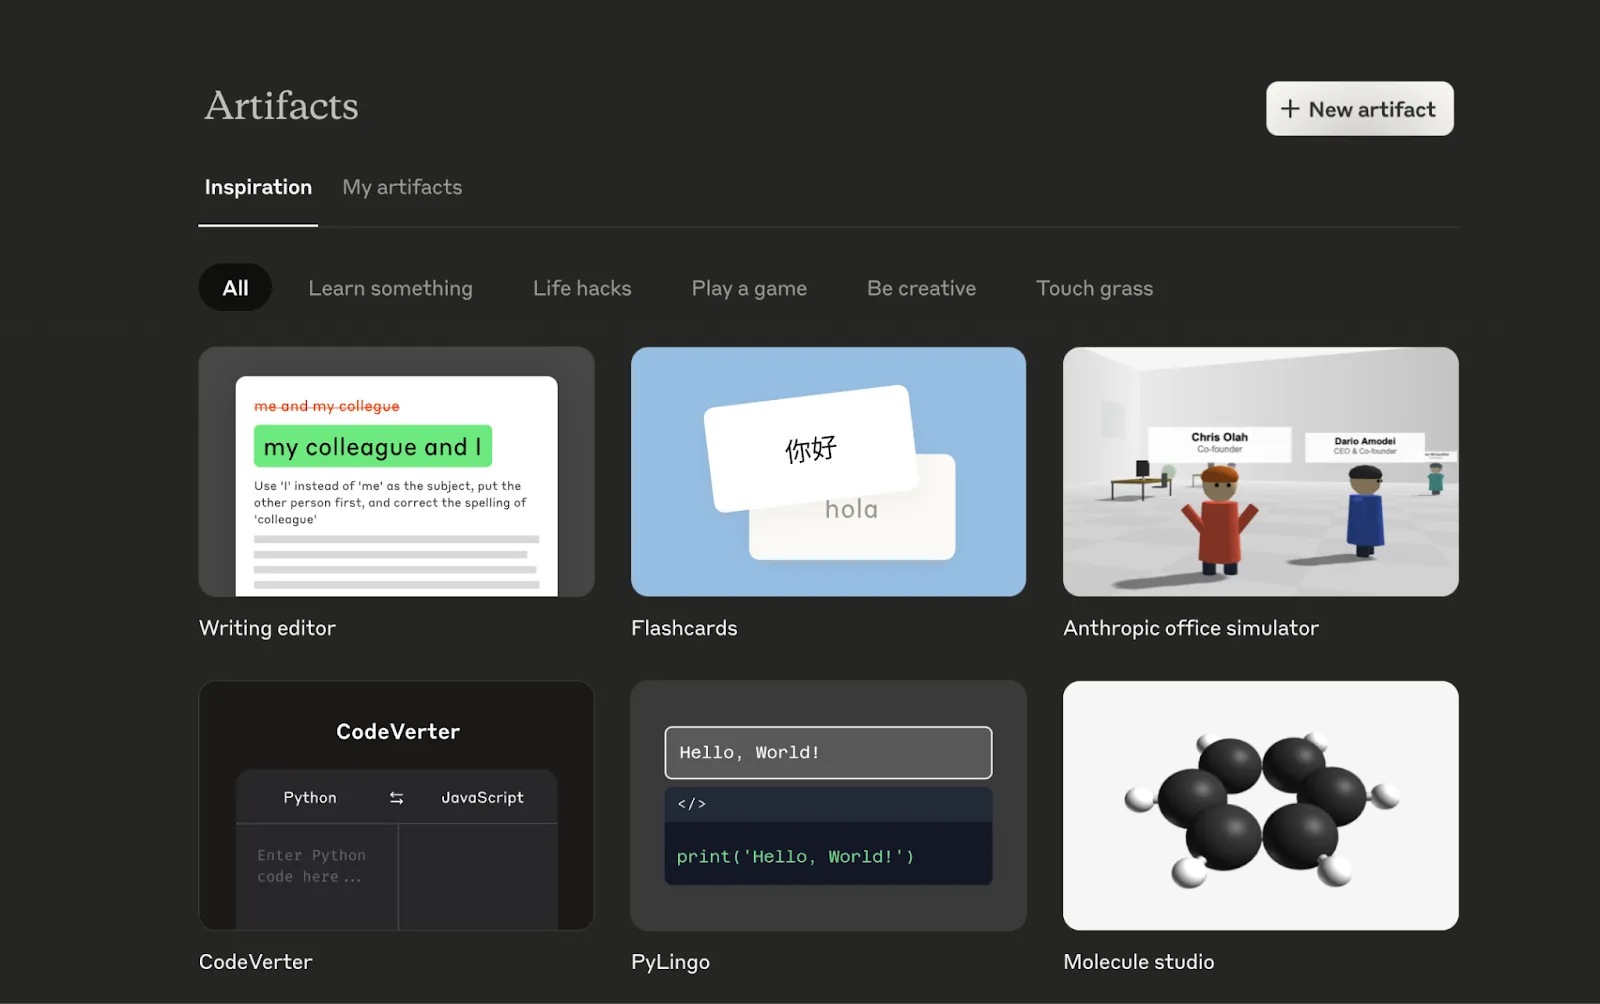
Start by heading to https://claude.ai/artifactsi and logging into your account. Once inside, click the “+ New Artifact” button on the top right of the screen.
This will open a workspace where you can describe the idea you want to bring to life, kind of like briefing your own personal developer.
Step 2: Choose what you want to build
You’ll be asked to pick the type of product you want to make. Since we’re building a full-stack app, choose “Apps and websites.”
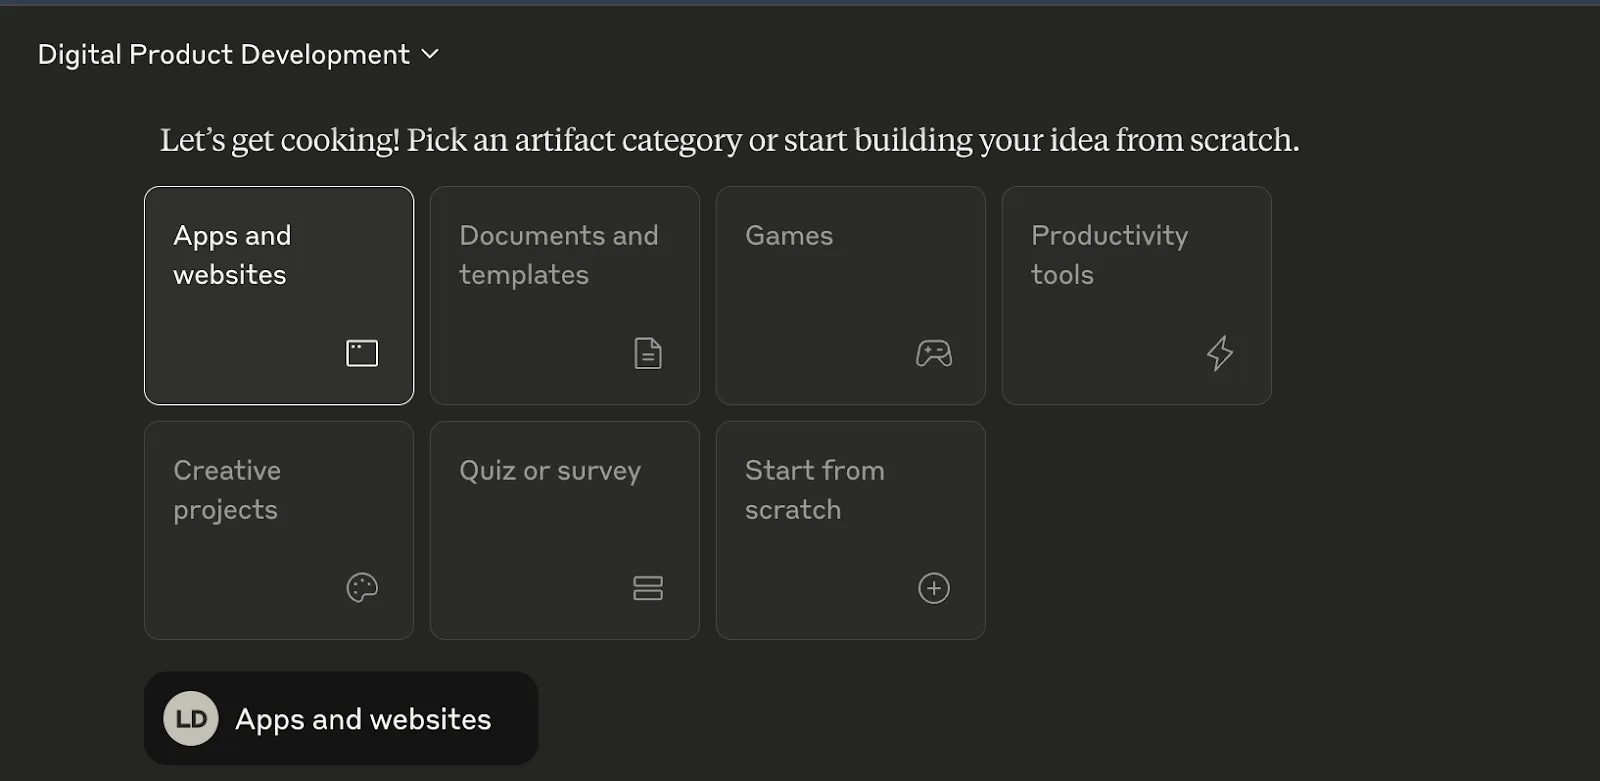
You’ll see other options like “Games,” “Productivity tools,” or “Creative projects,” but for a dashboard generator that includes frontend + backend logic, this is the most powerful starting point.
Step 3: Paste in this Claude-ready prompt
Now comes the most exciting part: describing your app clearly so Claude can build it for you. Paste this prompt into the description box:
“Build a full-stack web application that allows users to upload CSV data files and automatically generates an interactive dashboard with key visualizations such as bar charts, line charts, and pie charts. The frontend should include drag-and-drop CSV upload, column selection, and filter options. The backend should parse the CSV, auto-detect column types (e.g., numeric, categorical), and provide clean API endpoints for data access. Use React for the frontend and Express/Node.js for the backend. The interface should be minimal, responsive, and include data summary indicators (total rows, selected columns, active filters).”
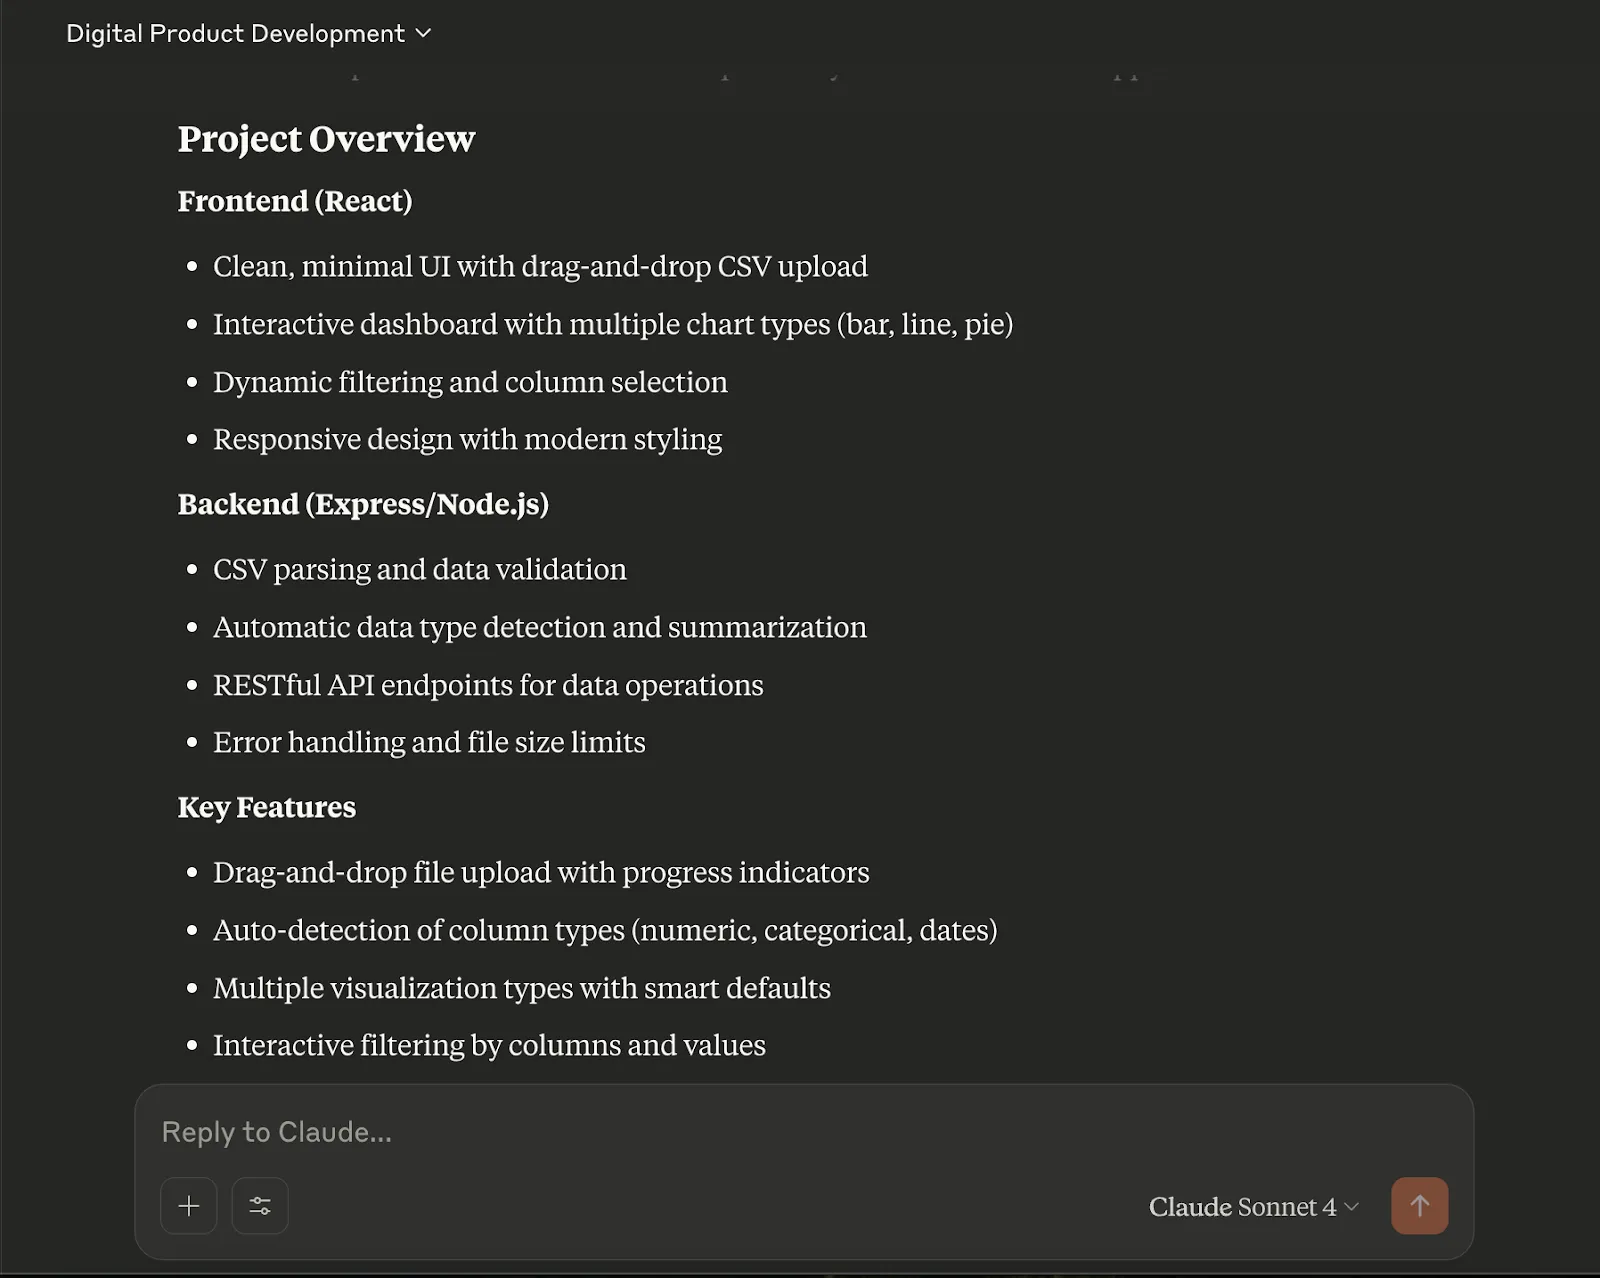
Claude will then generate a project overview summarizing the frontend stack, backend functionality, and key features. This is your chance to review everything before the Artifact actually gets built. If something looks off, you can clarify it in natural language (e.g., “I want stacked bar charts too” or “let’s include tooltips on hover”).
Step 4: Test the app and refine it live
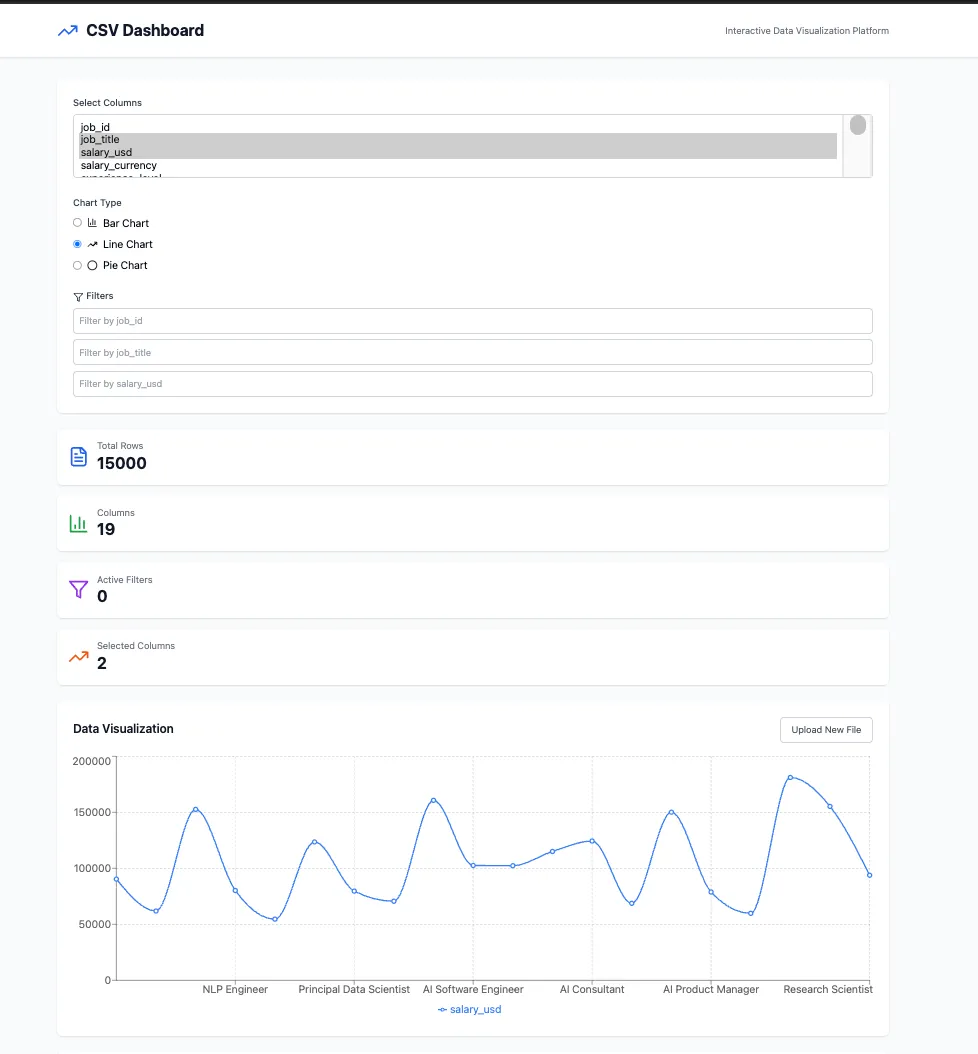
Once you confirm the setup, Claude will start generating the app, including backend code, frontend UI, and even sample data if needed. Here is the result of our prompt.
You can interact with the app directly in the browser, upload a CSV (you can find open data on Kaggle), explore the charts, and see if it fits your use case.
Want to tweak the layout? Add a donut chart? Or include Google Sheets support instead of CSV? Just ask Claude in plain English, and it will regenerate the artifact with your changes.
Step 5: Explore use cases and build on top
Now that you have a working dashboard generator, here are some ideas to take it further:
- Startup Metrics Tool: Upload investor updates or MRR tracking and get visual insights instantly.
- Team Feedback Dashboard: Drop in survey exports and see trends by role, department, or sentiment.
- Build a gallery of data templates so users can try the app even without uploading their own file.
Even if you don’t ship this app, going through this flow helps leaders and product thinkers better understand how generative AI can translate a vision into a working product. It’s a great way to experiment with AI-assisted development and unlock creative ideas for your own team.
